INVESTMENT PROCESS
OVERVIEW
In our investment process we make a strict distinction between
- Tactical strategy allocation (Where to invest?) and
- Risk management (How much to invest?)

FIRST PROCESS OF THE INVESTMENT: TACTICAL STRATEGY ALLOCATION
- forms the basis for our investment decisions
- permanently tests our systematic trading strategies
- permanently conducts a qualitative and quantitative ranking of our strategies
- routes the trading decisions of the best strategies to live trading

STRATEGY DEVELOPMENT
- Development of new systematic trading strategies and variations on existing strategies
- Backtesting systems
- Qualitative assessment of test results
- If a strategy meets all the quality criteria it is incorporated in the strategy universe and tested live.

STRATEGY RANKING
- Ongoing assessment of strategies in the strategy universe
- Ranking is based on different statistic variables
- Only the trading signals of the best strategies are forwarded to the portfolio.

RELEVANCE
Trading strategies are subject to the following non-exhaustive list of problems:
- Every trading strategy incurs losses under certain market conditions (draw-down phases)
- Increasing market efficiency continuously erodes the return of existing trading strategies
- Prevailing market structures impose capacity limits on strategies (position limits)
- By applying the ranking from the tactical strategy allocation it is possible to avoid applying strategies that suffer from the problems described above.
The following tests show some examples of the problems described above.
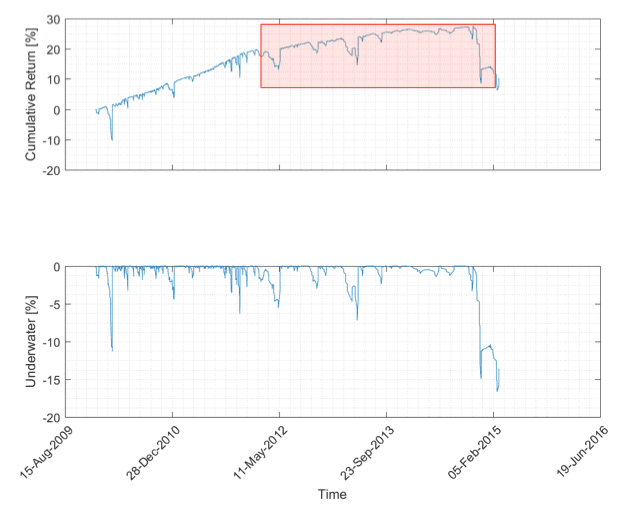
EXAMPLE 1: RETURN EROSION, TREND-FOLLOWING STRATEGY ON EURUSD
- From September 2009 to January 2012 the strategy generated steady returns. This is reflected in the positive increase in cumulative return
- From January 2012 the curve flattens and even becomes negative at the end. This is known as return erosion (see red area)
- The ranking gives a lower value to strategies that suffer from return erosion.

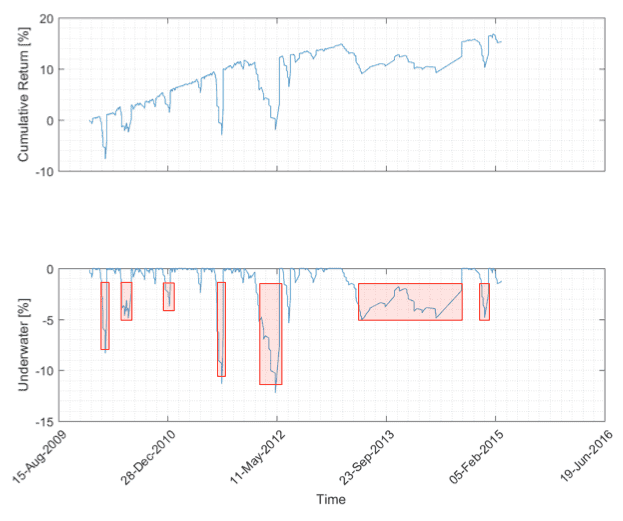
EXAMPLE 2: DRAW-DOWN PHASE, MEAN REVERSION STRATEGY ON EURUSD
Looking at the strategy’s underwater curve (lower chart) we see that:
- Over the period the strategy has several larger and smaller draw-down phases (see red area)
- The ranking gives a lower value to strategies in draw-down phases.

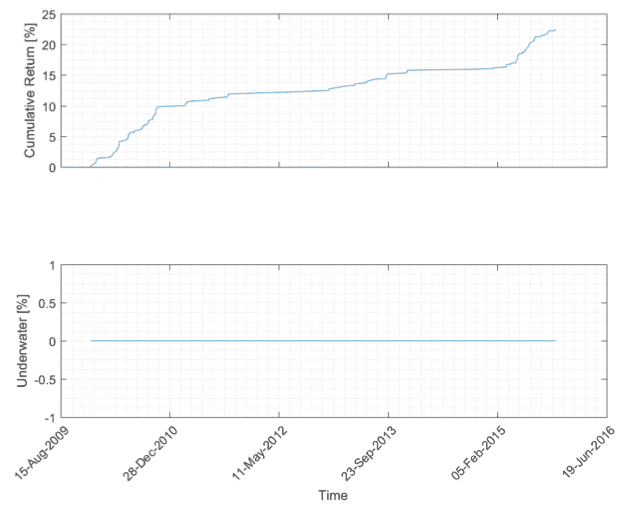
EXAMPLE 3: CAPACITY LIMITS, STATISTICAL ARBITRAGE STRATEGY
Looking at the strategy’s underwater curve (lower chart) we see that:
- The strategy has no draw-down phases over the period, which seems optimal
- Due to this strategy's short investment horizon and the prevailing market structures only limited positions can be traded
- This strategy is ranked higher than the previous examples. If this strategy is routed to the portfolio it is weighted by the risk management process.

