Performance
31 march 2024
A managed account represents an alternative investment in the currency markets. The profits and income generated are subject to a revolving principle known as absolute return. The investments made using the account are exclusively on the spot foreign exchange market. The trading approach we apply involves fundamentals and technical analysis including behavioral finance.
The general yield profile of foreign currency strategies has been found to be relatively stable and also largely decoupled from the yields of equities, deposits, bonds and other such assets. This means that investments in currencies represent an excellent alternative for those seeking to achieve a sustained increase in asset values and a contribution to greater added value.
NET PERCENTAGE PERFORMANCE OF THE MANAGED ACCOUNT
| YEAR | JAN. | FEB. | MAR. | APR. | MAY | JUNE | JULY | AUG. | SEP. | OCT. | NOV. | DEC. | TOTAL |
|---|---|---|---|---|---|---|---|---|---|---|---|---|---|
| 2010 | 5.2 | -0.8 | 10.0 | 4.6 | 7.3 | 8.4 | 2.9 | 2.0 | -0.4 | 1.4 | 9.6 | -1.6 | 57.4 |
| 2011 | -5.6 | 4.4 | 4.4 | -5.2 | 8.2 | 11.5 | 37.8 | -42.3 | 30.4 | 7.5 | 6.9 | 2.2 | 43.7 |
| 2012 | 3.7 | 9.4 | 2.9 | 0.9 | -8.1 | -4.2 | -5.4 | -3.8 | 10.2 | 2.3 | -4.3 | 10.5 | 12.5 |
| 2013 | 29.4 | -0.8 | 1.2 | 3.1 | 7.8 | -0.7 | 0.7 | 1.3 | -6.2 | 1.4 | 2.7 | 2.8 | 46.8 |
| 2014 | 1.7 | -4.7 | 2.6 | 0.4 | 4.9 | -5.7 | 10.0 | -2.9 | 8.8 | -5.6 | 0.7 | 5.8 | 14.7 |
| 2015 | -18.2 | 7.4 | 8.8 | -4.2 | 9.4 | 2.9 | 6.2 | 3.1 | 0.6 | 1.4 | 8.3 | -1.3 | 23.0 |
| 2016 | 6.9 | 0.3 | -2.4 | 3.5 | 5.3 | 1.4 | 0.7 | 1.1 | 2.4 | 3.2 | 0.7 | 1.9 | 27.6 |
| 2017 | -0.2 | -0.4 | 1.7 | 1.1 | -0.3 | -1.5 | -1.2 | -1.1 | 1.8 | 2.2 | 0.8 | 1.2 | 4.1 |
| 2018 | 1.6 | 1.8 | -0.3 | 1.7 | 1.6 | 0.8 | 1.1 | 1.6 | 0.9 | 1.3 | 1.8 | 0.4 | 15.2 |
| 2019 | 1.3 | 2.7 | -0.5 | 4.6 | 0.4 | 0.3 | -2.3 | 0.4 | 0.6 | 1.6 | 0.4 | 0.2 | 9.9 |
| 2020 | -1.9 | 0.2 | -11.3 | -2.6 | 9.2 | 8.6 | 2.7 | 0.8 | 1.8 | 3.1 | 2.4 | -0.3 | 11.8 |
| 2021 | 1.3 | 2.1 | 5.4 | 2.3 | 1.2 | -0.2 | 0.8 | 0.6 | 0.4 | -0.2 | -0.3 | 0.1 | 14.0 |
| 2022 | -0.9 | 0.1 | 0.3 | 0.1 | -0.2 | 0.1 | 1.3 | -1.8 | 3.3 | 0.6 | 1.4 | -1.4 | 2.8 |
| 2023 | -1.2 | -1.8 | -2.8 | 0.3 | -4.6 | 1.8 | -3.7 | -0.9 | 0.3 | -5.7 | -2.3 | 0.1 | -18.9 |
| 2024 | -0.3 | -1.6 | -0.9 | -2.8 |
The performance represents a cross section of all managed accounts and may differ from that of individual accounts. The difference between the reported annual results and the sum of the various monthly profits is due to the reinvestment effect. All fees due have been deducted from the reported results, which are thus disclosed net of all deductions. The managed accounts mentioned here are kept in CHF, EUR and USD.
Average annual performance since the beginning of January 2010: 18.8% net per annum
KEY DATA
The accounts we manage are segregated individual accounts held at the Switzerland-based bank where, although the bank administers clients’ deposits itself for accounting purposes, their actual management is assigned to a different financial institution (WINBRIDGE). Account holders are entitled at any time to stop the trading on their managed accounts and have the entire capital or any part thereof paid out to them. Account holders grant an investment manager a limited mandate to execute transactions on their accounts. This mandate relates exclusively to instructions to buy, sell and trade currencies on the spot market. The managers are not entitled, and furthermore do not have any opportunity, to transfer, pay out or deliver the money or other assets held in the managed account either to themselves or any third parties.
| Traded currency pairs | majors, major cross pairs | Consecutive negative months | 4 |
| Sharpe ratio (Rf = 2%) 12 months | -2.53 | Consecutive positive months | 11 |
| Sharpe ratio (Rf = 2%) 36 months | -2.87 | Overall growth per month | 1.5% |
| Sharpe ratio annualized 01/2010 | 0.64 | Previous three months | -2.8% |
| Maximum drawdown | 42.3% | Previous six months | -10.4% |
| Maximum unbroken growth | 63.9% | Average performance since 2010 | 18.8% |
| Drawdown below capital invested | 0.0% | Overall growth since 01/2010 | 263.3% |
Performance since january 2010: 263,3 %
Disclaimer: Trading in Forex entails a high degree of risk. Accordingly, this financial instrument is not suitable for all investors. Please therefore ensure that you fully understand the risks involved. Historic results do not give rise to any entitlement to future performance. This fact sheet does not constitute an offer. A legally valid offer can only be made on request, in conformity with the applicable law and in conjunction with a corresponding operative asset management contract. Wherever necessary you should consult your own independent, qualified legal and financial advisers and other professional advisers as necessary in order to ensure that any decision you make is suitable for you in light of your circumstances and financial situation. This fact sheet is intended solely as the foundation for exhaustive explanatory discussions. WINBRIDGE AG and its affiliated companies provide no guarantee for the correctness of any of the data and disclaim liability for any disadvantages arising either directly or indirectly from the use of this document or the content hereof. Actual profits or losses may be much greater than those reported herein. Investments in foreign currencies are exposed to exchange rate fluctuations. Exchange rates and returns may rise or fall, and positive past performance does not constitute any guarantee for positive future performance.
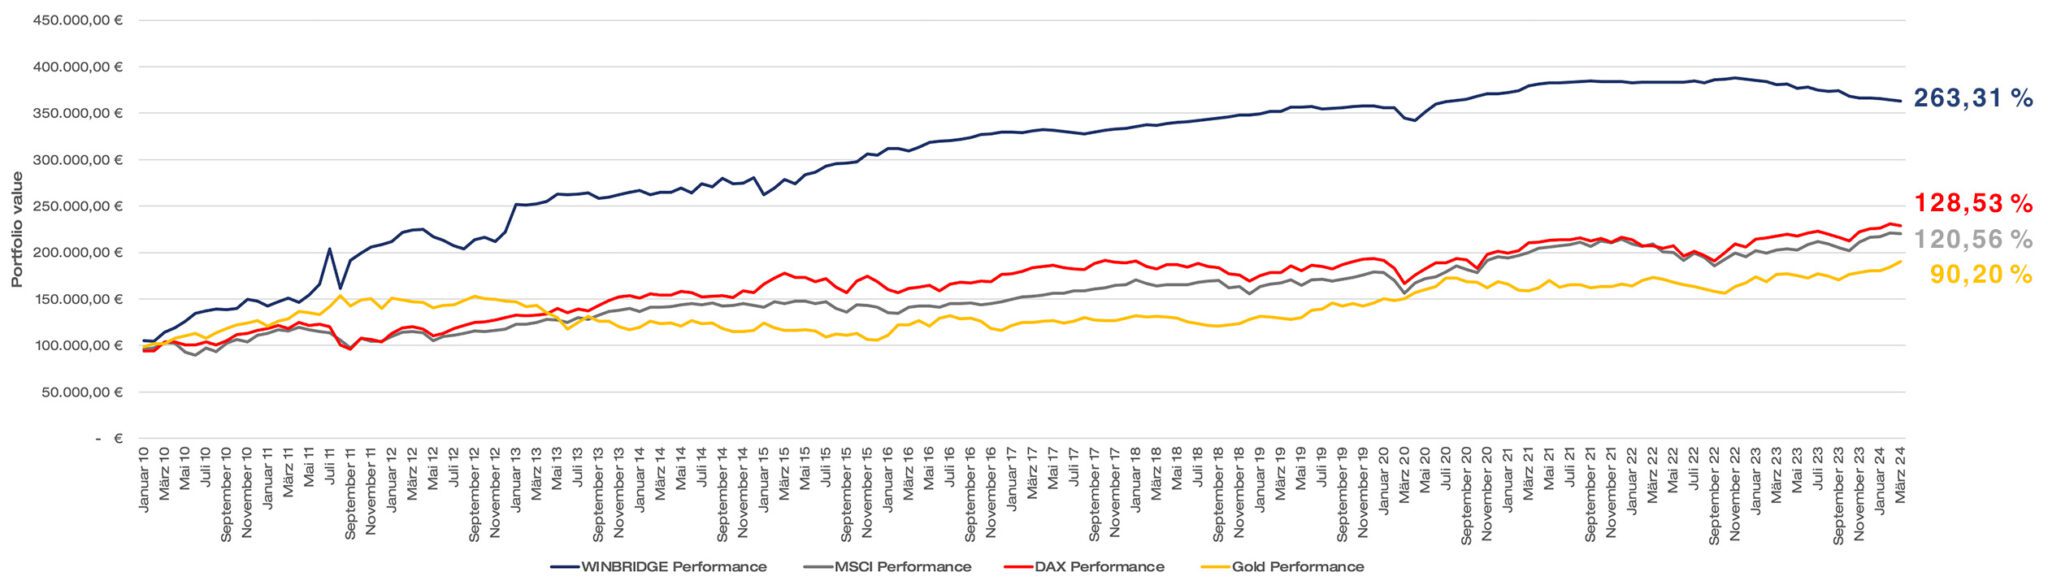
Performance (additives) in comparison with other asset classes with an investment volume of €100,000
The following values relate to a period of fourteen years and three month (as of march 31, 2024).
Comparison in chart view
Comparison in table view
| WINBRIDGE | MSCI WORLD | DAX | GOLD | |
|---|---|---|---|---|
| Performance total | 263.306,91 € | 120.560,00 € | 128.530,00 € | 90.200,00 € |
| Addition of returns | 263,31 % | 120,56 % | 128,53 % | 90,20 % |
| Average return p. a. | 18,70 % | 8,56 % | 9,13 % | 6,40 % |
Data sources: WINBRIDGE own calculation — MSCI World Net USD, https://www.msci.com/accept-terms-and-conditions —
DAX, own calculation with data from https://firstratedata.com/ — Gold, https://de.investing.com/commodities/gold-historical-data
Berechnungsmethode: Performance has been mapped by adding annual returns.
Any questions?
We would be happy to inform you in detail. Please contact us!